Monday, September 14, 2009

Electricfly Continues to Log Energy Consumption

It has been some time since the last post due to continuing efforts in a variety of areas - no the least of which is the logging of PakTrakr energy use data and UM100 Energy Monitor recharge energy consumption data for comparisons.

Of course the time involved with the AeroCap Project and Website development, some time on the website for my electricfly, and duties as the webmaster for The Electric Vehicle Society of Canada, as well as their Editor for EV Surge - Their Newsletter.

Oh yes - I also work a regular Job at Bombardier Aerospace - DeHaviland, full time, as an Aircraft Assembler, and have been spending some time trying to return to the re-design of my first website - Aircraft Computational, wherein I largely was able to collate a large number of interesting links in the Aviation and PC fields - under - links, and to create and share - for free - pdf based Tutorials for Alibre Design - and excellent 3D CAD Solids Modeler.

Beyond that I have been trying to find time to develop our new - Telecommunications Business, which means learning the ropes, and helping people save money on their home phone, Internet, and long distance communications, as well as get good deals on Cell Phones, Home Security, and Satellite Digital TV. Of these - my Favourite is the Video Phone

On to the Electricfly - the Data logging is a process of logging on an SD Flash Memory Card the running data with the Woodward PakTrakr Display with the SD Card Reader/Writer, then taking the card and uploading the raw data to my PC in .csv format and giving it and easily identifiable name to match the date and activity. This is then tweaked - removing the data that is not deciphered, or that is reserved, but not interpreted, and the file is re-saved with a modified name - still as a .csv file.

The new .csv file is then re-saved with a normal excel extension, and the data is then tallied, added, averaged, checked for peaks in a min-max format, and simplified for easier grasping.

Unfortunately, of late I have only been able to log the data and upload it in raw form to the PC for later cleaning up. I did clean up some of the files this spring, but the process is a bit slow, when combined with, or inserted into the flow of everything else to do.

This coming Thursday - September 18th, 2009 - is the next general meeting for the Electric Vehicle Society, and I still have to complete the July-Aug 2009 EV Surge Newsletter, so I have been a bit behind. They are having an executive meeting today to plan some things, which I have committed to attend. So - as you see - the electricfly has some time competition now.

Since the UM100 Energy Monitor does not have any data card storage system, I have captured that data by taking pictures of the monitors display after a charge cycle is completed, along with Pictures of the Odometer and trip meters for reference. This information is compared to the energy consumed between charges according to the PakTrakr Display SD Card data, The UM100 shows time, kwh's used, and as I have programmed the current 13 cents per kwh net that I pay -the total dollars (or cents) worth of electricity used.

Wednesday, July 1, 2009

Superlattice Power Inc Increased Efficiency of Li-Ion Battery

In a Press Release dated June 24, 2009, Superlattice Power, Inc. announced a battery inovation that can increase the range of an electric car by 1.5 times.

According to the Release: "The new technology was used by EV Innovations Inc. and the driving range of electric car has been increased by at least 1.5 times. Further research work will be continued with a next generation battery pack where the cathode material with superlattice structure will be used and the expected specific capacity is 1.5 times compared to the cathode, LiMnxNiyCozO2."

They have developed a new charging algorithm as well, using a multistage charging rate, unusual in Li-Ion Charging profiles.

According to their website - "SLAT (Or Superlattice Power Inc.) has taken a step ahead to pioneer Superlattice Cathode Material for the use in Lithium Ion Rechargeable. HYBT has successfully introduced Superlattice nano and submicron materials from laboratory to industrial scale."

Tuesday, May 26, 2009

Repositioned the Woodward Display for Better Viewing

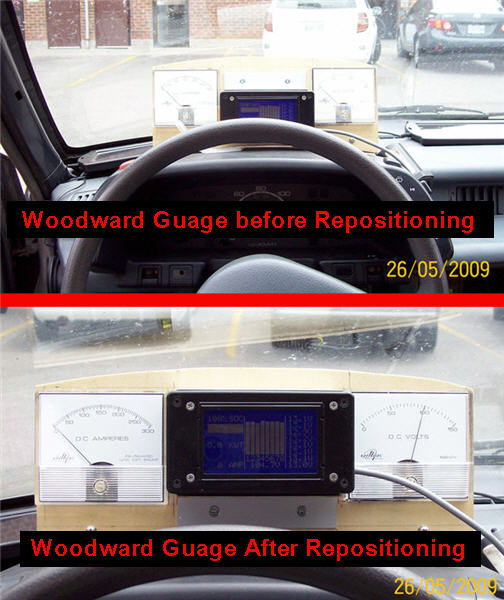
Well, After Driving the Car since last September with the Woodward Enhanced PakTrakr Display mounted on a new test Cluster location, and noting that it was low and hard to see the information at the bottom of the display - Total Pack Volts - I had been thinking for some time to reposition it up higher for better and easier viewing.

Well Finally - 8 months later - I get the idea, the method, and the bug to get it done! So - now here it is - I simply removed and rotated the two pieces of aluminum angle - which moved the display up about an inch, giving better viewing and clears the steering wheel line of sight better! Also, I inserted a small piece of foam, to bring the display away from the plywood a bit to clear the cable from the voltmeter.

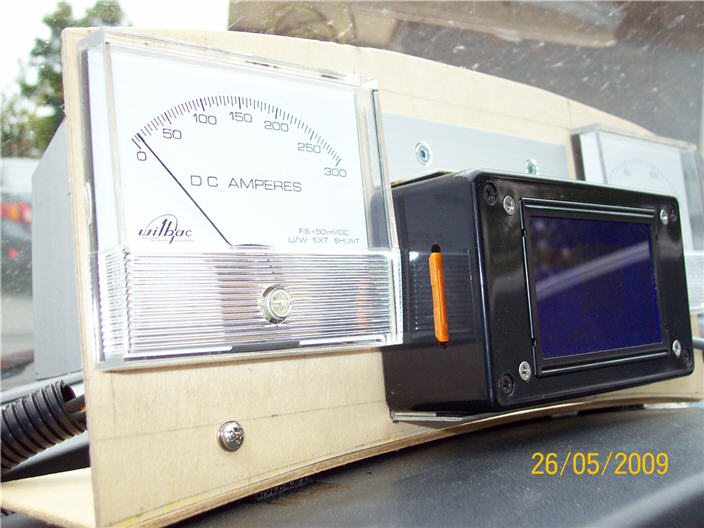
You can see from the comparison pictures - that the displays top edge is now even with the Analog Voltmeter and Ammeter, instead of below them, as it was before. This Side view also shows the SD Card used to log data with .csv or comma delimited format, which I simply open with Excel, and then select the columns of data that I wat, or re-arange them in my own preference for better viewing.

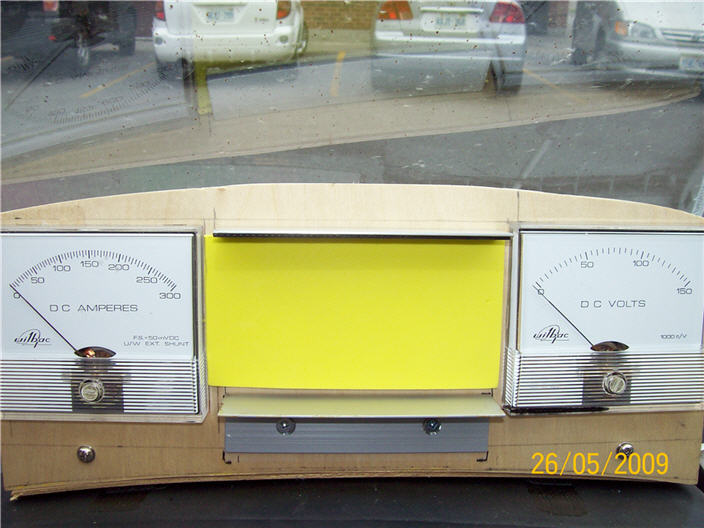
Also - the part that bugged me about making the repositioning, as the data cable coming out, and the thickness of the voltmeter, being thicker than the space from the cable to the back of the Woodward case. So I tested three different materials to prop the case out a bit so the cable would clear. I finally settled on some simple 1/8" thick yellow craft foam, and two Velcro connector squares to set the depth offset so the cable would clear the face of the voltmeter without binding, and yet still have enough grip in the two small 1"x 1" aluminum angles to hold the display.

So - Now - the drive is more comfortable, in that I am not haveing to repeatedly strain or lean forward to see over the steering wheel so as to see the digital valu of the pack voltage on the display, and it is generally more comforatable because it is in a nice Horizontal line of sight with the other two guages!

Sunday, May 10, 2009

Driving to work for a week costs less than 16 Cents!

I decided to log the energy and power used for the electricfly for a whole ten trips, 5 to work and 5 to home, and see what was the total energy used! So, for the Week of May 4th to May 8th, I logged the power data on the Woodward enhance paktrakr display with SD card, so I could take each days worth of data and analyse it, then tally it all for the week, compared to the charge afterwords.

The State of Charge (SOC) ran from 100% on the PakTrakr Display (and the Woodward Paktraker Display) at the start of the test, to 52% SOC at the end of the test, however - the battery chargers indicated between 75% SOC and 85% SOC on start up in the battery condition test mode! So - this either means they chargers are optimistic of the batteries energy capacity or the PakTrakr is more pessimistic in its analysis of the battery condition. It also means that when the PakTrakr says the pack is at 20% SOC, I would hopefully have not totally drained the Batteries, and have some safe reserve to maintain their life.

The Average Watt Hours per Kilometer (Wh/Km) ranged from a minimum of 78.21 to a maximum of 193.97 for the week. The Total logged energy used was 1,002 Watt Hours, or 1.002 kWh, while the power used in the 5 hour 50 minute recharge time (It continues in float mode when charged, and I did not check it at any regular interval, so it might have been charged in 2- 3 hours!), was 1.23 kWh according to my energy meter (UPM EM100, from Canadian Tire), for a actual energy efficiency of 81.47%, and a total energy cost at a net rate of 12.7 Cents per kWh equals fifteen point six two Cents ($0.1562) or - less than sixteen cents to drive to work for a week!

While it is true that I live very close to work, just an average drive for the week of 0.92 kms each way or a total of 9.2 kms for the week, the idea is connected to theis next couple of ideas: How much super capacitor capacity would I need for my actual drive to work, best and worst cases, and - would four, 15 Watt Solar Panels (1 amp each) produce enough power for my drive to work and still maintain or recharge the energy used in my drive to work, given the amount of sun available to them usually?

A Short look at the supercapacitor equation is based on the Watt-Seconds or Joules of energy used in my drive to work and home. This comes out to a peak used watt seconds per second of 20,690 and a maximum of 642,415 Watt Seconds or Joules for the full drive to work or home. Of course - the minimum was less, at just 259,044 Watt Seconds or Joules, with a typical value between 280,000 to 380,000 Watt Seconds per trip.

Why use or consider this idea? Well - as the Lead-Acid (PbA) Batteries are really so poor at large loads, and long runs at large loads, this gives a buffer for the acceleration currents needed, and the PbA's can slowly back fill the SuperCap's before and after a drive run so as to have better drive performance, and better battery life.

For Example Minimum Voltages on each Battery for the week, B1=9.1V, B2=3.0V, B3=8.6V, B4=9.1V, B5=8.1V, B6=8.6V, B7=8.2V, and B8=8.7V. Keeping in mind a minimum Voltage of 10.5 Volts, it can be seen that each battery ran below the minimum Voltage, and Battery #2 was the worst, with a Drop to 3.0 Volts at one point under load. Luckily, the BattEQ Eaualizers brought it back up to a good voltage for the next run, but it still dropped down to 6.3 Volts during that run (Going Home on Friday).

Friday, May 1, 2009

Cheap to run but slow to charge!

Well, I drove the electricfly to work today (April 30th, 2009), but my trusty trip meter I use for tracking runs was reset a few times to zero by kids doing the standard 'fingerpokenpeepenlooker' routine while at the show on Saturday! Plus - it had been towed there and back, partially discharged from giving a fellow EVer a quick ride in it one night after my last EVS meeting, and I had driven it to the Bank yesterday, so I decided to charge it up, reset the trip meter again, and stick a notebook back in tha car!

In any case - after charging it up today - I checked the UPM EM100 energy meter I am using to note the numbers - 1.95 kWh, $0.253 at $0.13 per kWh, but it was 8 hours 1 minute and 40 seconds since I plugged it in after work, and I have no easy way to be informed that the pack is full after I leave the car! (Call to the Cell phone or home number when charging is complete would be nice, but I haven't heard of it on the market nor of anyone trying to make such a charger - cell phone interface!

Now the real question would be - how far did I drive on that 1.95 kWh? Good Question - was it 3 km? 5km? More? Less? Well - at first guess - the drive with my buddy was only maybe about 2-3 kms, and the drive in to the show on Saturday was maybe another 1.5 kms, and out about .3 after the show. a drive to the bank is about 1.8 - 2.5 kms, and a drive to work and back is about 1.8 kms - so add it all up and we get an approximate figure of up to 9.1 kms. So - if true - that would be about 214 1/4 watt hours per km! Not so bad, but not my best figure! In any case - that is why I charged it up again tonight - so as to be able to again check the figures with a fresh start!

Plus - using the PakTraker Display with the Data logger with an SD Card, I can compare monitored energy used (watt seconds added all up inside a spreadsheet or two, get my kWh figures and compare that with the power used on the next charge. Today might have been charged up in only 2-3 hours - but I was busy and it was raining outside (still is) do did not check it out a lot over the course of the evening!